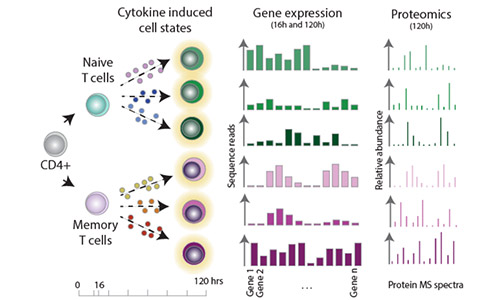
 Figure 1.A. - Overview of the experimental design
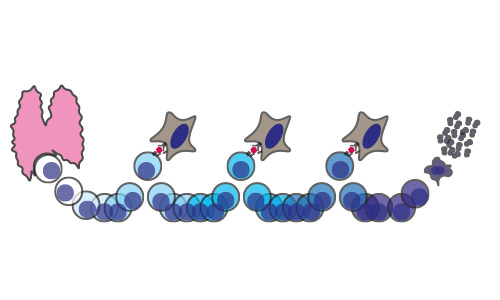 Figure 1.B. - Graphical representation of conclusion of paper
Access the data generated in the study "Single-cell transcriptomics identifies an effectorness gradient shaping the response of CD4+ T cells to cytokines". For a detailed explanation of the study and the approaches for data generation, please refer to our publication:
Data Downloads
Datasets for this project can be accessed from this public repository: